To check if the values are in another column in Excel, you can apply the following formula to deal with this job.
1. First, you can copy the two columns of data and paste them into column A and Column C separately in a new worksheet, leave Column B blank to put the following formula.
2. Enter this formula: =IF(ISERROR(VLOOKUP(A2,$C$2:$C$11, 1, FALSE)),FALSE,TRUE ) into cell B2, and press Enter key, see screenshot:
Tips: in the above formula, A2 is the cell of the first column that you want to check if it is in another column, and $C$1:$C$11is the column that you want to be compared with.
3. Then select cell B2, and drag the fill handle over to the cells that you need to apply this formula, you will get the following result, TRUE stands for the value in Column A exists in Column C as well, and FALSE indicates the value is not in Column C.
Launch SQL Server Management Studio and connect with credentials that have been granted the 'sa' role.
Expand *Security*, right-click on *Logins* and select *New Login*.
Enter a descriptive *Login name*, select *SQL Server authentication*, and enter a secure password. On the bottom of the page select the database Chartio will be connecting to as the *Default database*.
Select the *User Mapping* tab, check the box next to the desired database, confirm that only 'public' is selected, and click *OK*.
Click the *New Query* button and select the database you are connecting to Chartio.
Paste the following query into the query window and execute. Replace "chartio_read_only" with the actual username of the user you created.
`SELECT 'GRANT SELECT ON "' + TABLE_SCHEMA + '"."' + TABLE_NAME + '" TO "chartio_read_only"' FROM information_schema.tables`
Select and copy the query results into the query window.
Remove any tables or views you do not wish the "chartio_read_only user" to have access to. In this example I have removed the Invoice and InvoiceLine tables because they contain sensitive information.
`GRANT SELECT ON "dbo"."Customer" TO "chartio_read_only"`
`GRANT SELECT ON "dbo"."Employee" TO "chartio_read_only"`
`GRANT SELECT ON "dbo"."Genre" TO "chartio_read_only"`
`GRANT SELECT ON "dbo"."MediaType" TO "chartio_read_only"`
`GRANT SELECT ON "dbo"."Playlist" TO "chartio_read_only"`
`GRANT SELECT ON "dbo"."PlaylistTrack" TO "chartio_read_only"`
`GRANT SELECT ON "dbo"."Track" TO "chartio_read_only"`
`GRANT SELECT ON "dbo"."Album" TO "chartio_read_only"`
`GRANT SELECT ON "dbo"."Artist" TO "chartio_read_only"
Execute the query.
You can now use these credentials to connect Chartio to your database with read-only permissions on only the tables you have specified.
I had issues with my exchange server today where it would sporadically stop receiving emails from our enterprises management system, photocopiers and UTM appliance, I found out what the issue was and thought it would be good to share this with other users
Exchange 2016 has a feature called Back Pressure which seems like a very good idea but caused me a major headache.
I was getting errors
453 4.3.1 insufficient resources on the UTM
and exchange transport errors explaining the were disconnecting external connections
as you can see from the QueueLength[SubmissionQueue] it is over the medium to high bracket and because of this it stops receiving emails until the threshold is reduced. I did have 79GB free on the local drive but this made no difference so what I ended up doing to fix this was:
Create another drive (mine was 100GB but unsure on specific requirements) on the SAN and attached it to the exchange server then migrated the Queue to it.
How to monitor backup and restore progress in SQL Server
Problem
My developers often ask me to create a database backup before any critical deployment or to restore a database to one of the test environments. They often ping me during the process to know the progress and when it will be completed. Sometimes the backup/restore is running through a SQL Agent job which looks hung and I want to know if it's actually doing something. In this tip I have tried to put forth a solution to monitor your backup/restore progress.
Solution
Normally we take a backup or restore a database either through the SSMS or through a script. We might also schedule it using a SQL Agent job. Now let's see how to monitor progress in all the three cases.
Note about permissions: Backup database permissions default to members of the sysadmin fixed server role and the db_owner and db_backupoperator fixed database roles. For restore, if the database being restored does not exist on the server, then the user must have CREATE DATABASE permissions to be able to execute the RESTORE. If the database exists, RESTORE permissions default to members of the sysadmin and dbcreator fixed server roles and the owner (dbo) of the database.
Using SSMS
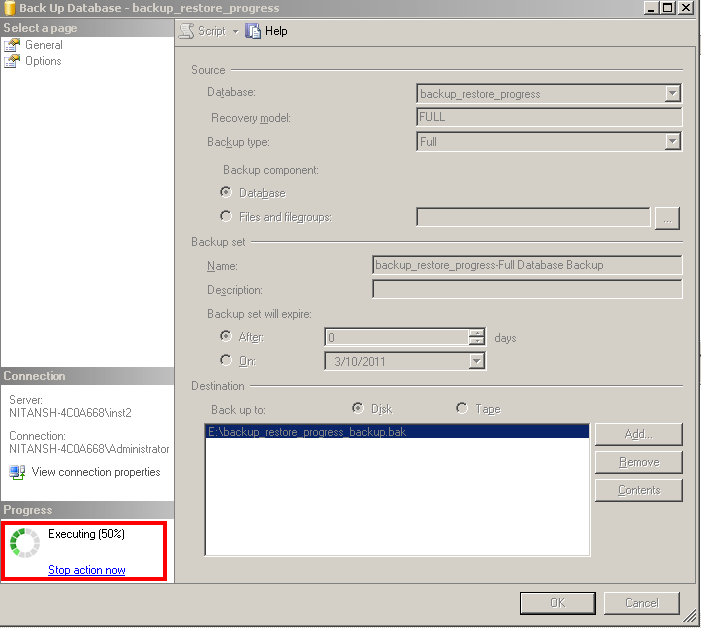
You can backup or restore a database using the GUI and see the stats for the process as follows. Open SSMS, right click on a database then select Task -> Backup or Restore. A screen similar to the below images will open depending if you are doing a backup or restore.
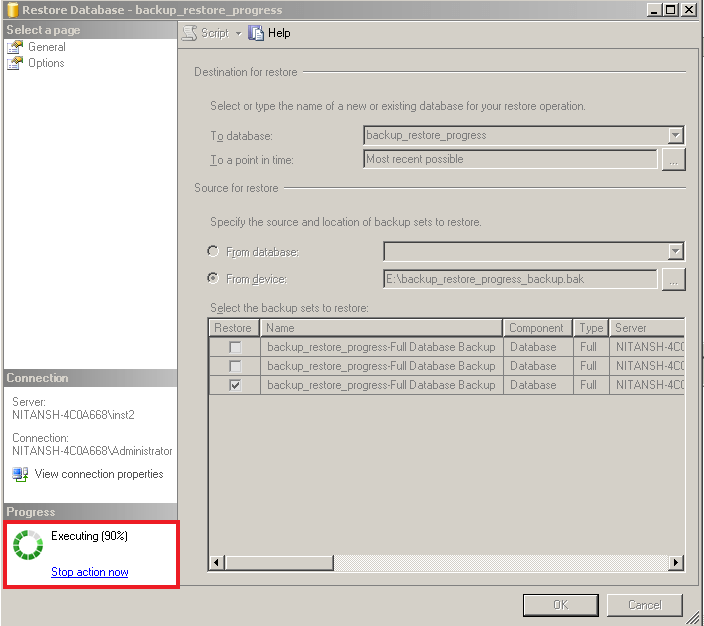
You can monitor the progress on the lower left side of the GUI as shown in the below images. This will give you an idea of the status of the backup or restore.
Backup Screen
Restore Screen
Using T-SQL
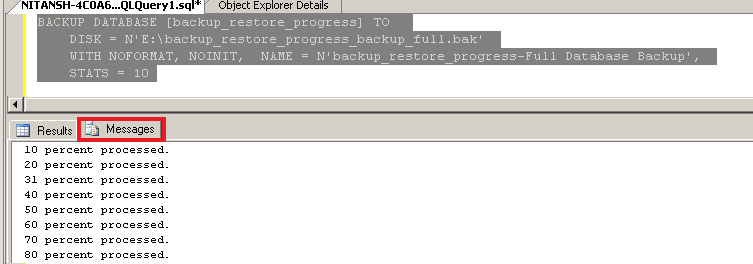
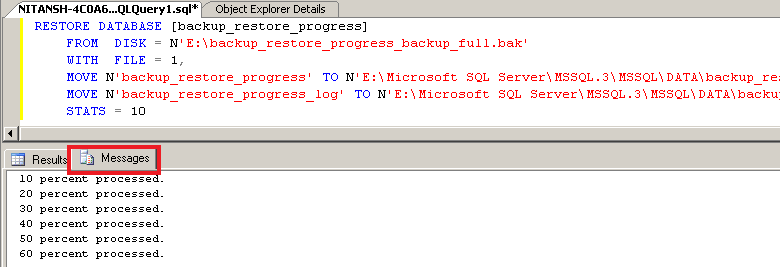
Scripts can be also be used to backup or restore a database and you can use the keyword ‘STATS' in the script to monitor progress.
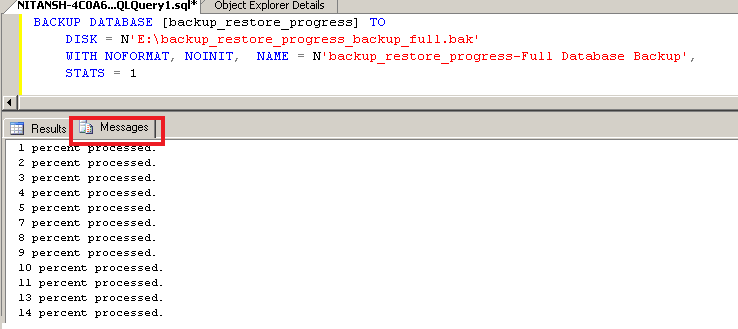
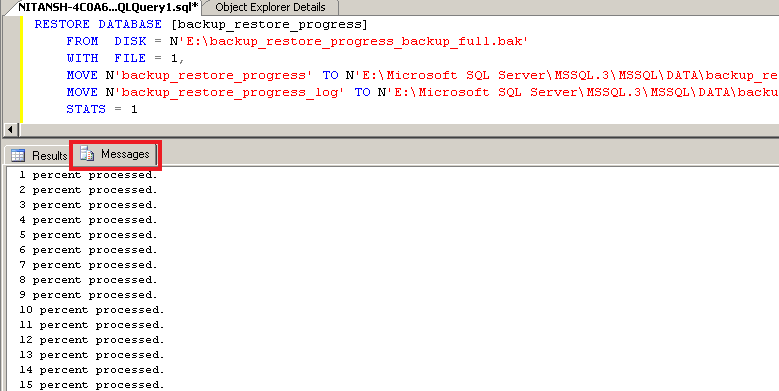
When using STATS, the number equals the total processing into parts equal to the number. So if you use STATS = 1, this will give you percent by percent completion from 1 to 100%.
Backup showing every 10% of progress
Backup showing every 1% of progress
Restore showing every 10% of progress
Restore showing every 1% of progress
Using DMVs
If the backup or restore is running from a SQL Agent job or maybe someone kicked off the process from another machine, you can use DMV - sys.dm_exec_requests to find the progress.I really thank Microsoft for introducing DMV's and making a DBA's life a lot easier.
You can run this script, which will give you output simliar to to the screenshot below. Here we can see the percent complete and estimated completion time. This script will work for any backup or restore that is currently running regardless of what method was used to run the backup or restore.
SELECT session_id as SPID, command, a.text AS Query, start_time, percent_complete, dateadd(second,estimated_completion_time/1000, getdate()) as estimated_completion_time
FROM sys.dm_exec_requests r CROSS APPLY sys.dm_exec_sql_text(r.sql_handle) a
WHERE r.command in ('BACKUP DATABASE','RESTORE DATABASE')
If you wanted someone who is not a member of sysadmin role to check backup/restore progress using this script, you can provide permission using the below command:
GRANT VIEW SERVER STATE TO [Login_name]
Note About Restores
I would like to touch base upon one more aspect of SQL Server which you will encounter while restoring databases. You may see that the restore is stuck at 100% or around 99.99% and is not moving further. Sometimes for databases that are very large, TB size databases, it may even take 5 hours for the recovery to complete. To understand this situation we need to understand the different phases that a restore goes through.
The three phases are Data Copy phase, Redo phase and Undo phase. While you may see the restore is 100% complete it's actually only the Data Copy phase that is complete and then SQL proceeds to subsequent phases before the recovery is totally complete.
In the Redo phase, all the committed transactions present in the transaction log when the database was being backed up are rolled forward.
In the Undo phase, all the uncommitted transactions in the transaction log while the database was being backed up are rolled back.
If the database is being restored with NORECOVERY, the Undo phase is skipped. Unfortunately SQL Server does not show the progress during the Redo and Undo phases as it does in the Data Copy phase. So, depending upon the activity in the database at the time it was getting backed up will decide the overall total recovery time.
Next Steps
The same DMV can be used to monitor DBCC shrink commands progress as well.
Efficient backup strategy is the backbone of disaster recovery and no other high availability solution can replace it.
Backups and restores take considerable amount of resources, so you need to plan the backup strategy and timings accordingly.
A backup file retention policy should also be created.
Keep critical database backups safe using data encryption introduced in SQL Server 2008.
In a previous post, I wrote about how one can go about patching ESXi from the command line using the esxcli software vib command. This is all well and good when you only have a couple of hosts at hand. What would you do instead when faced with a significant number of hosts you need to update? The short answer is, use vSphere Update Manger (VUM). I’ve written about VUM in the past, so I’m skipping the how to install and configure it bits. If you’d like to learn more, have a look at these:
One of the features I like most about vCSA 6.5, is that VUM comes readily installed with the appliance, something that was on everybody’s wishlist since the appliance first shipped out. If you’re running vCenter Server for Windows, well, you’re stuck with installing VUM manually.
Today, I’ll be using vCenter Server Appliance 6.5 to update an ESXi 6.5 GA host to 6.5.0 d. The 4-part update process is as follows:
Import an ESXi image to VUM
Create a baseline
Attach the baseline
Remediate
vSphere Update Manager
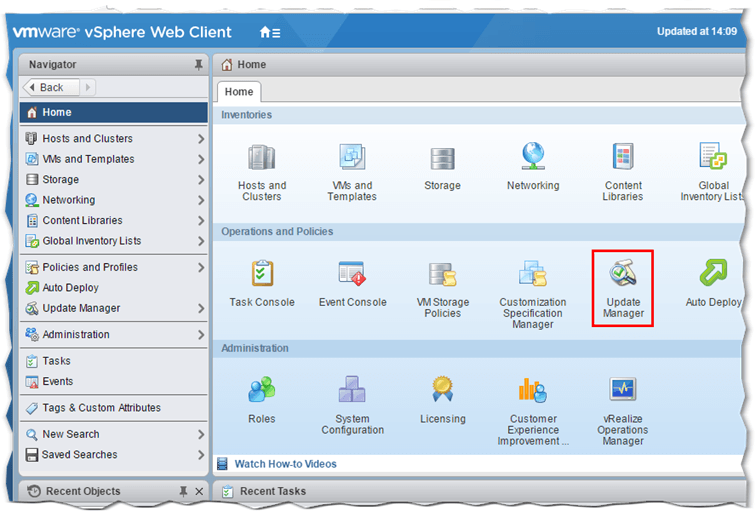
Update Manager comes as a vCenter plug-in which is accessible from a number of places within vSphere Web client. To load it, click on the Update Manger icon from the Home screen or simply select the vCenter Server hostname in Navigator and change over to the Update Manger tab. The interface consists of two main views, Admin and Compliance. The Admin view allows you to configure various aspect of VUM itself as well as manage baselines, the patch repository and ESXi images. The Compliance view, on the other hand, is where you carry out tasks such as attaching baselines, scanning for applicable updates and remediating.
Figure 1 – The Update Manager icon on the Home screen in vSphere Web Client
How to import an ESXi image
So, the first thing we need to do to update ESXi via VUM, is to download the respective image from my.vmware.com and import it to Update Manager.
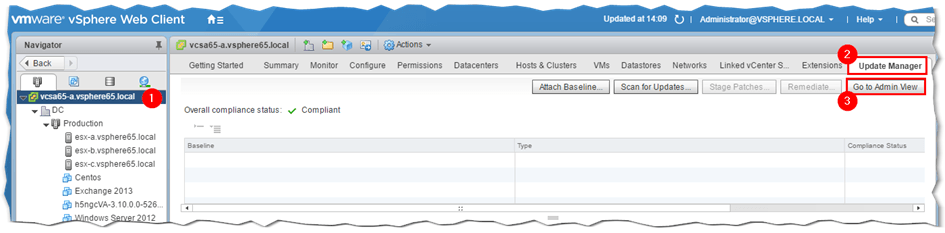
Step 1 – Highlight the vCenter Server name in Navigator, select the Update Manager tab and click on the Go To Admin View button.
Figure 2 – Changing to VUM’s Admin view in vSphere Web client
–
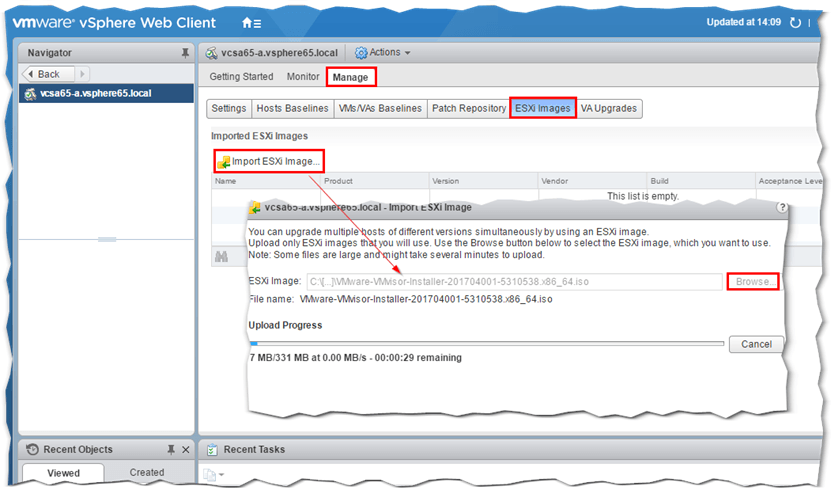
Step 2 – Once in Admin view, select the ESXi Images tab and click on Import ESXi Image. Doing so, loads another dialog box where you specify the ESXi image (ISO file) you want imported. Click on Browse and navigate to the folder where the image is stored. Select the ISO file and click OK. The file will upload as shown in Fig. 3. The upload progress bar, shows the remaining time and the speed at which the file is being uploaded.
Figure 3 – Importing an ESXi ISO image to VUM
–
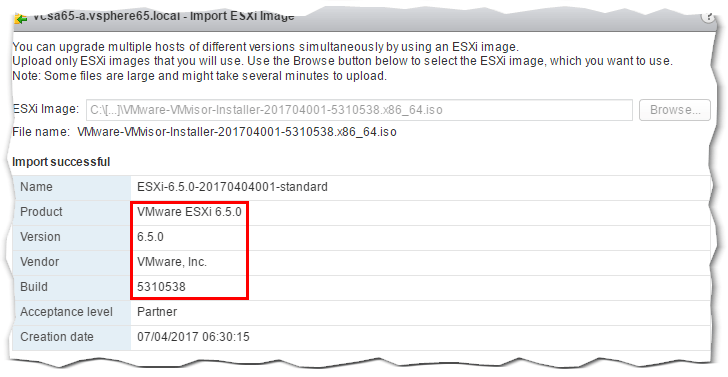
Step 3 – Once the ISO is uploaded, details about the ESXi image are displayed as per Figure 4.
Figure 4 – Product and version details for the ESXi image just imported
–
Creating a baseline
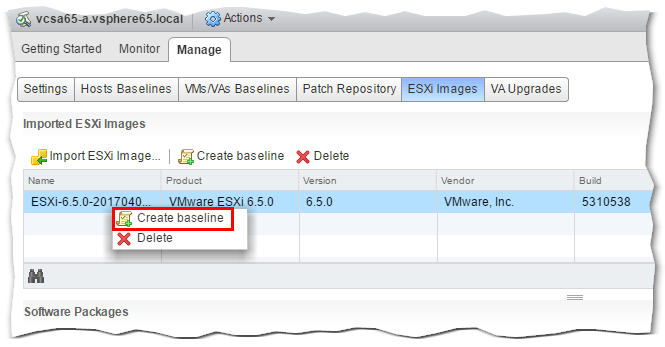
Step 4 – Next, we create what’s called a Host Baseline. To do this, we simply right-click on the image just imported and select Create baseline as shown in Figure 5.
Figure 5 – Creating an ESXi host baseline
–
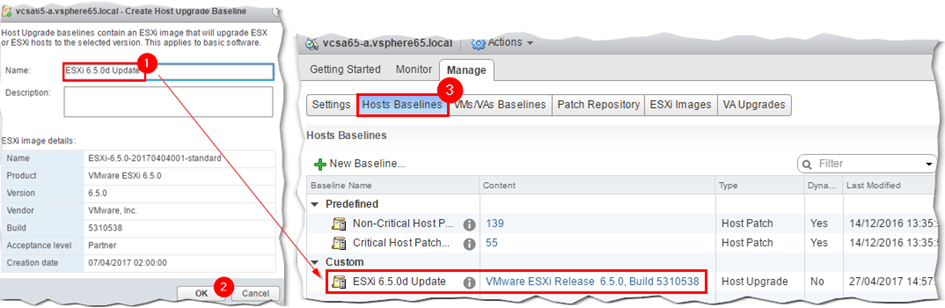
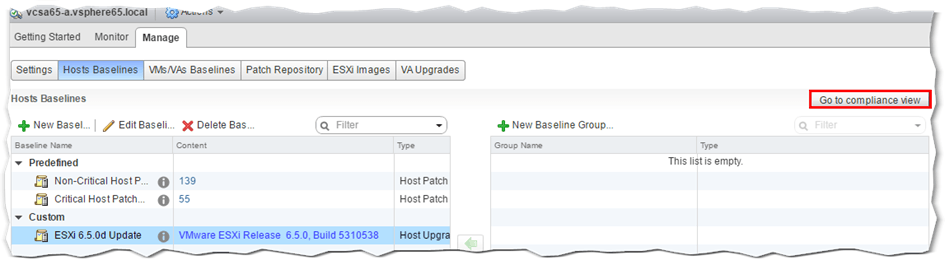
Step 5 – Type in a name for the baseline and press OK. The baseline should now be listed under the Hosts Baselines under Custom as per Fig. 6.
Figure 6 – The freshly created baseline as listed under the Hosts Baselines screen
–
Attaching a baseline
Step 6 – We’re almost there. The idea now is to attach the baseline to one or more hosts. We then run a compliance check to determine if the upgrade or update is actually required. To do this, one must change over to Compliance view. Just hit the Go to compliance view button at the top-right corner as shown in Fig. 7.
Figure 7 – Changing over to Compliance view
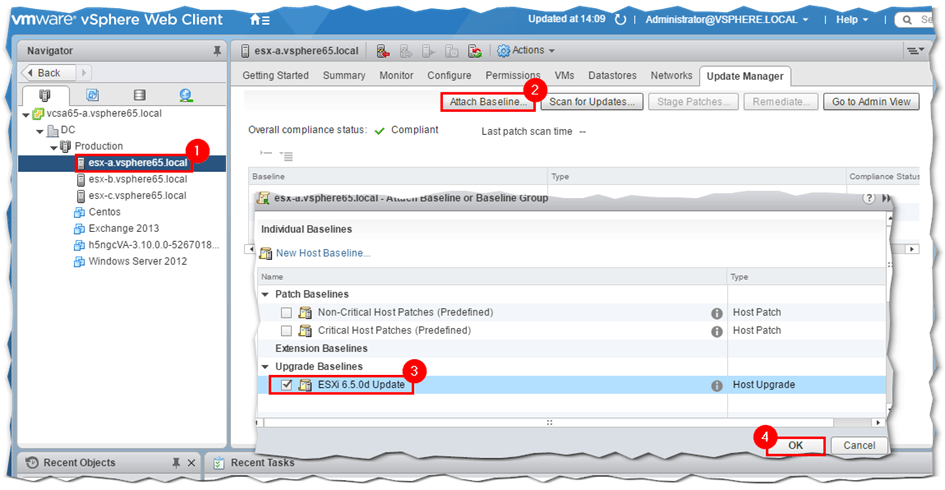
The baseline can in fact be attached to a number of objects including a datacenter, cluster or an individual ESXi host. This is what allows you to patch multiple hosts. It is important to note though that you may inadvertently hit hosts not earmarked for updates so be careful when attaching baseline to higher level objects.
In the example that follows, I’ve attached the baseline to one of three ESXi hosts forming a cluster.
Figure 8 – Attaching a baseline to a host
–
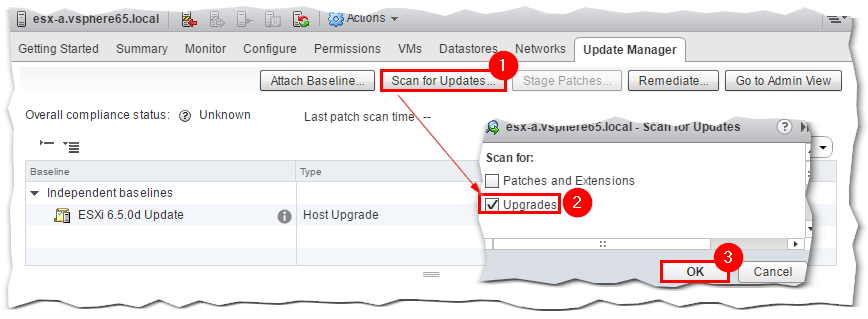
Step 7 – Next, we carry out a scan on the host to verify that the update/upgrade is in fact required. From the same screen, click on Scan for Updatesand select Upgrades on the dialog that pops up followed by OK. This will initiate a scan the results of which are displayed under the Compliance Status column after the scan completes.
Figure 9 – Scanning a host for compliance
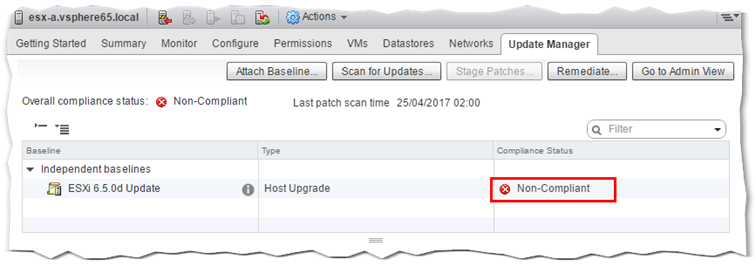
As expected, the host is found to be non-complaint, meaning that the 6.5.0d update is in fact applicable.
Figure 10 – A non-compliant result indicates that the host is missing one or more updates
How to remediate the host
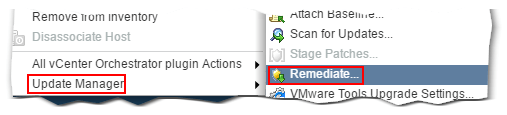
In this case, remediating is the act of pushing a patch or update to an ESXi host. A host is remediated by clicking on the Remediate button. Alternatively, right-click on the ESXi hostname (or IP address) in Navigator and select Remediate from the Update Manager menu.
Figure 11 – Remediating a host from the context menu
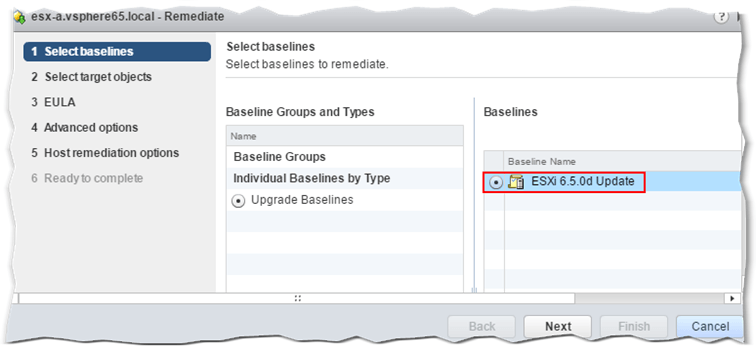
Step 1 – The remediation process starts by selecting the baseline image you want applied. In this case, I’ve selected the one created for the 6.5.0d upgrade.
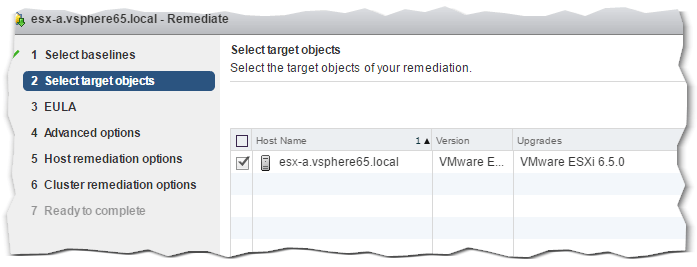
Step2 – Next, select the host you wish to remediate. In this case, only one host is listed which is the one highlighted in Navigator. If say, the baseline had been attached to a cluster, then you’d have all the hosts within that cluster listed as target objects.
Figure 13 – Remediation Step 2 – Selecting the target to remediate
Step 3 – Accept the EULA by ticking the box at the bottom.
Figure 14 – Remediation Step 3 – Accept the End User License Agreement
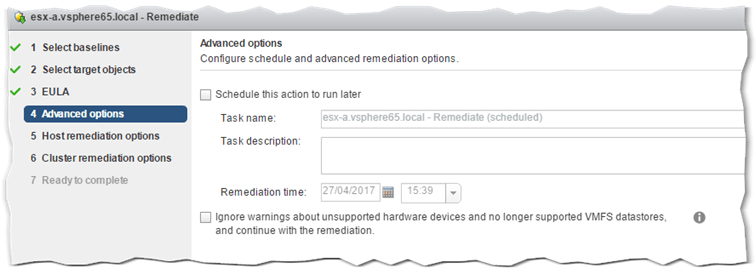
Step 4 – The next screen, gives you the option to postpone remediation tasks to a later date and time. You can also set the task to ignore warnings in reference to unsupported devices and such.
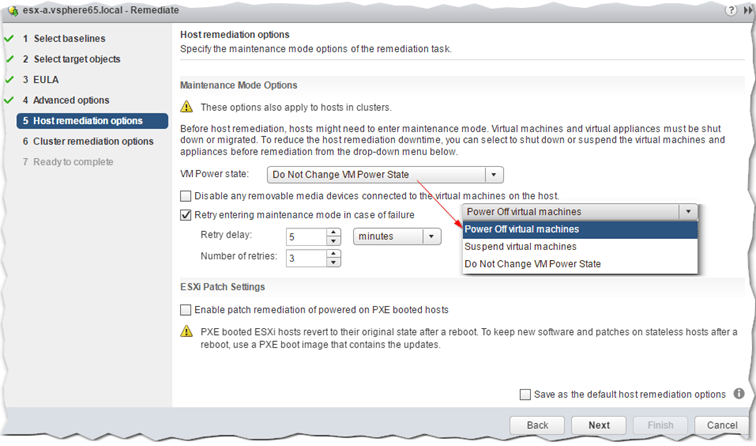
Step 5 – In all probability, the ESXi being remediated will be hosting VMs. This screen gives you control over what happens to the VMs currently powered on. You can choose to have them powered off, suspended or leave them in their current state. Like it or not, powered on VMs must be migrated or shut down for the remediation process to complete. Your options are to migrate VMs manually to some other host or simply power them off prior to remediating. Alternatively, set the VMs to power down by selecting the Power Off virtual machines option from the VM Power State drop-down box as shown in Fig. 16. You can also set the task to disconnect removable media from any hosted VMs as this may cause the remediation task to stall.
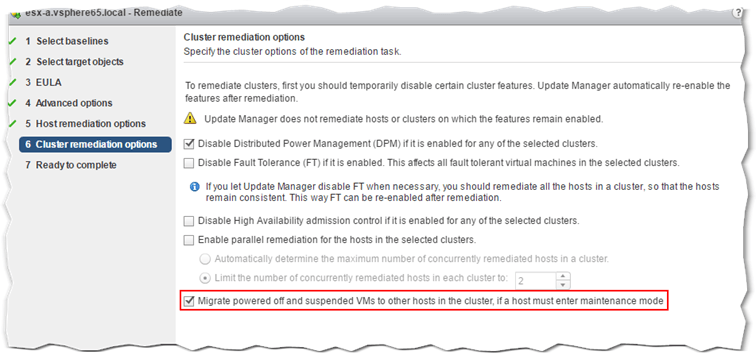
Step 6 – If the host being remediated is a cluster member, you can control various aspects related to clustering as shown in Fig. 17. Further details on each setting are available here.
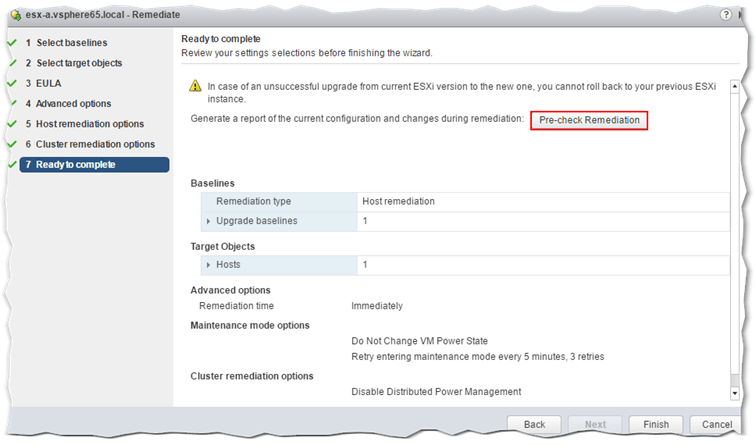
Step 7 – The Pre-check Remediation tasks runs a series of checks and generates a report of what exactly is carried out on the host. Press Finish to initiate the remediation task.
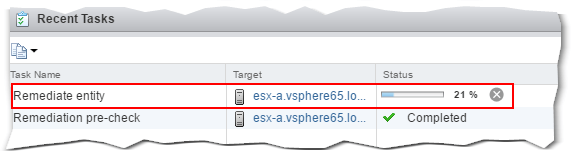
The remediation task’s progress is displayed in the Recent Tasks window in vSphere Web client.
Figure 19 – A remediation task in progress
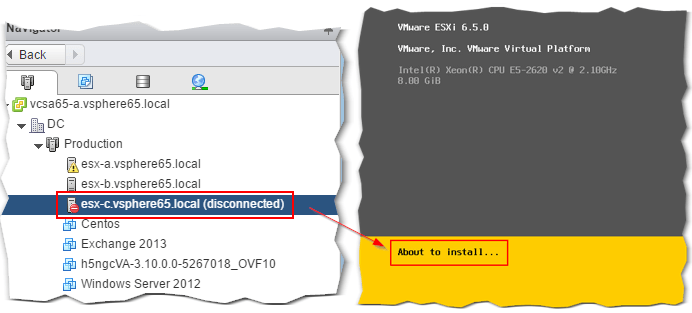
The host should enter maintenance mode and later disconnect while the update is being applied. It should then reboot and re-connect automatically, assuming the remediation processes succeeded in updating the host.
Figure 20 – A host is disconnected while being updated as can be seen in vSphere client and DCUI
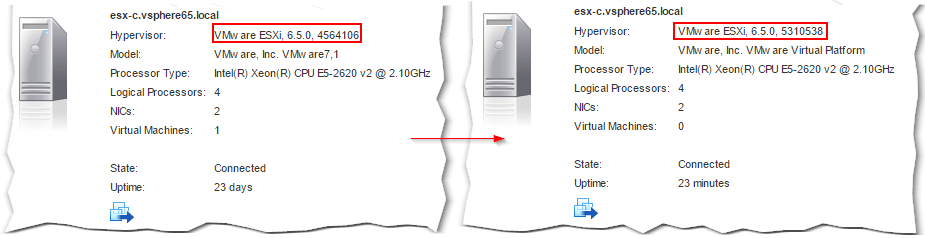
Once remediation completes, you can easily verify that the host is running the latest version by inspecting the host details on the Summary screen. Fig. 21 compares the host’s summary pre and post remediation.
Figure 21 – Comparing ESXi version details pre and post remediation
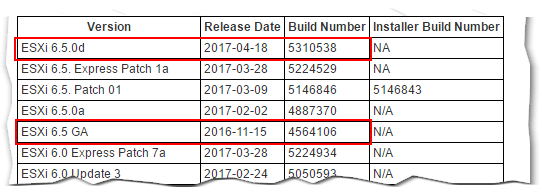
This VMware KB article helps you correlate build and version numbers if needed. As per the partial table below, you can see that in our case, the ESXi host updated from 6.5 GA to 6.5.0d.
Figure 22 – Correlating ESXi version and build numbers